
Bluffing in poker
In poker, you can win a hand in two ways. You can win by having the best hand at showdown. Or you can win by making your opponent fold…

Preflop
range charts
Preflop range charts are one of the fastest ways to improve your poker results. They give you a clear default strategy for which hands to play and what action to take before the flop.
Many beginners lose money because they play too many hands, play the wrong hands from the wrong positions or call too often without a plan. Preflop range charts solve that problem by giving you a structured baseline.
You might also hear people call them poker preflop charts or a poker starting hands chart. The idea is the same. You look up your position and your hole cards, then follow the recommended action.
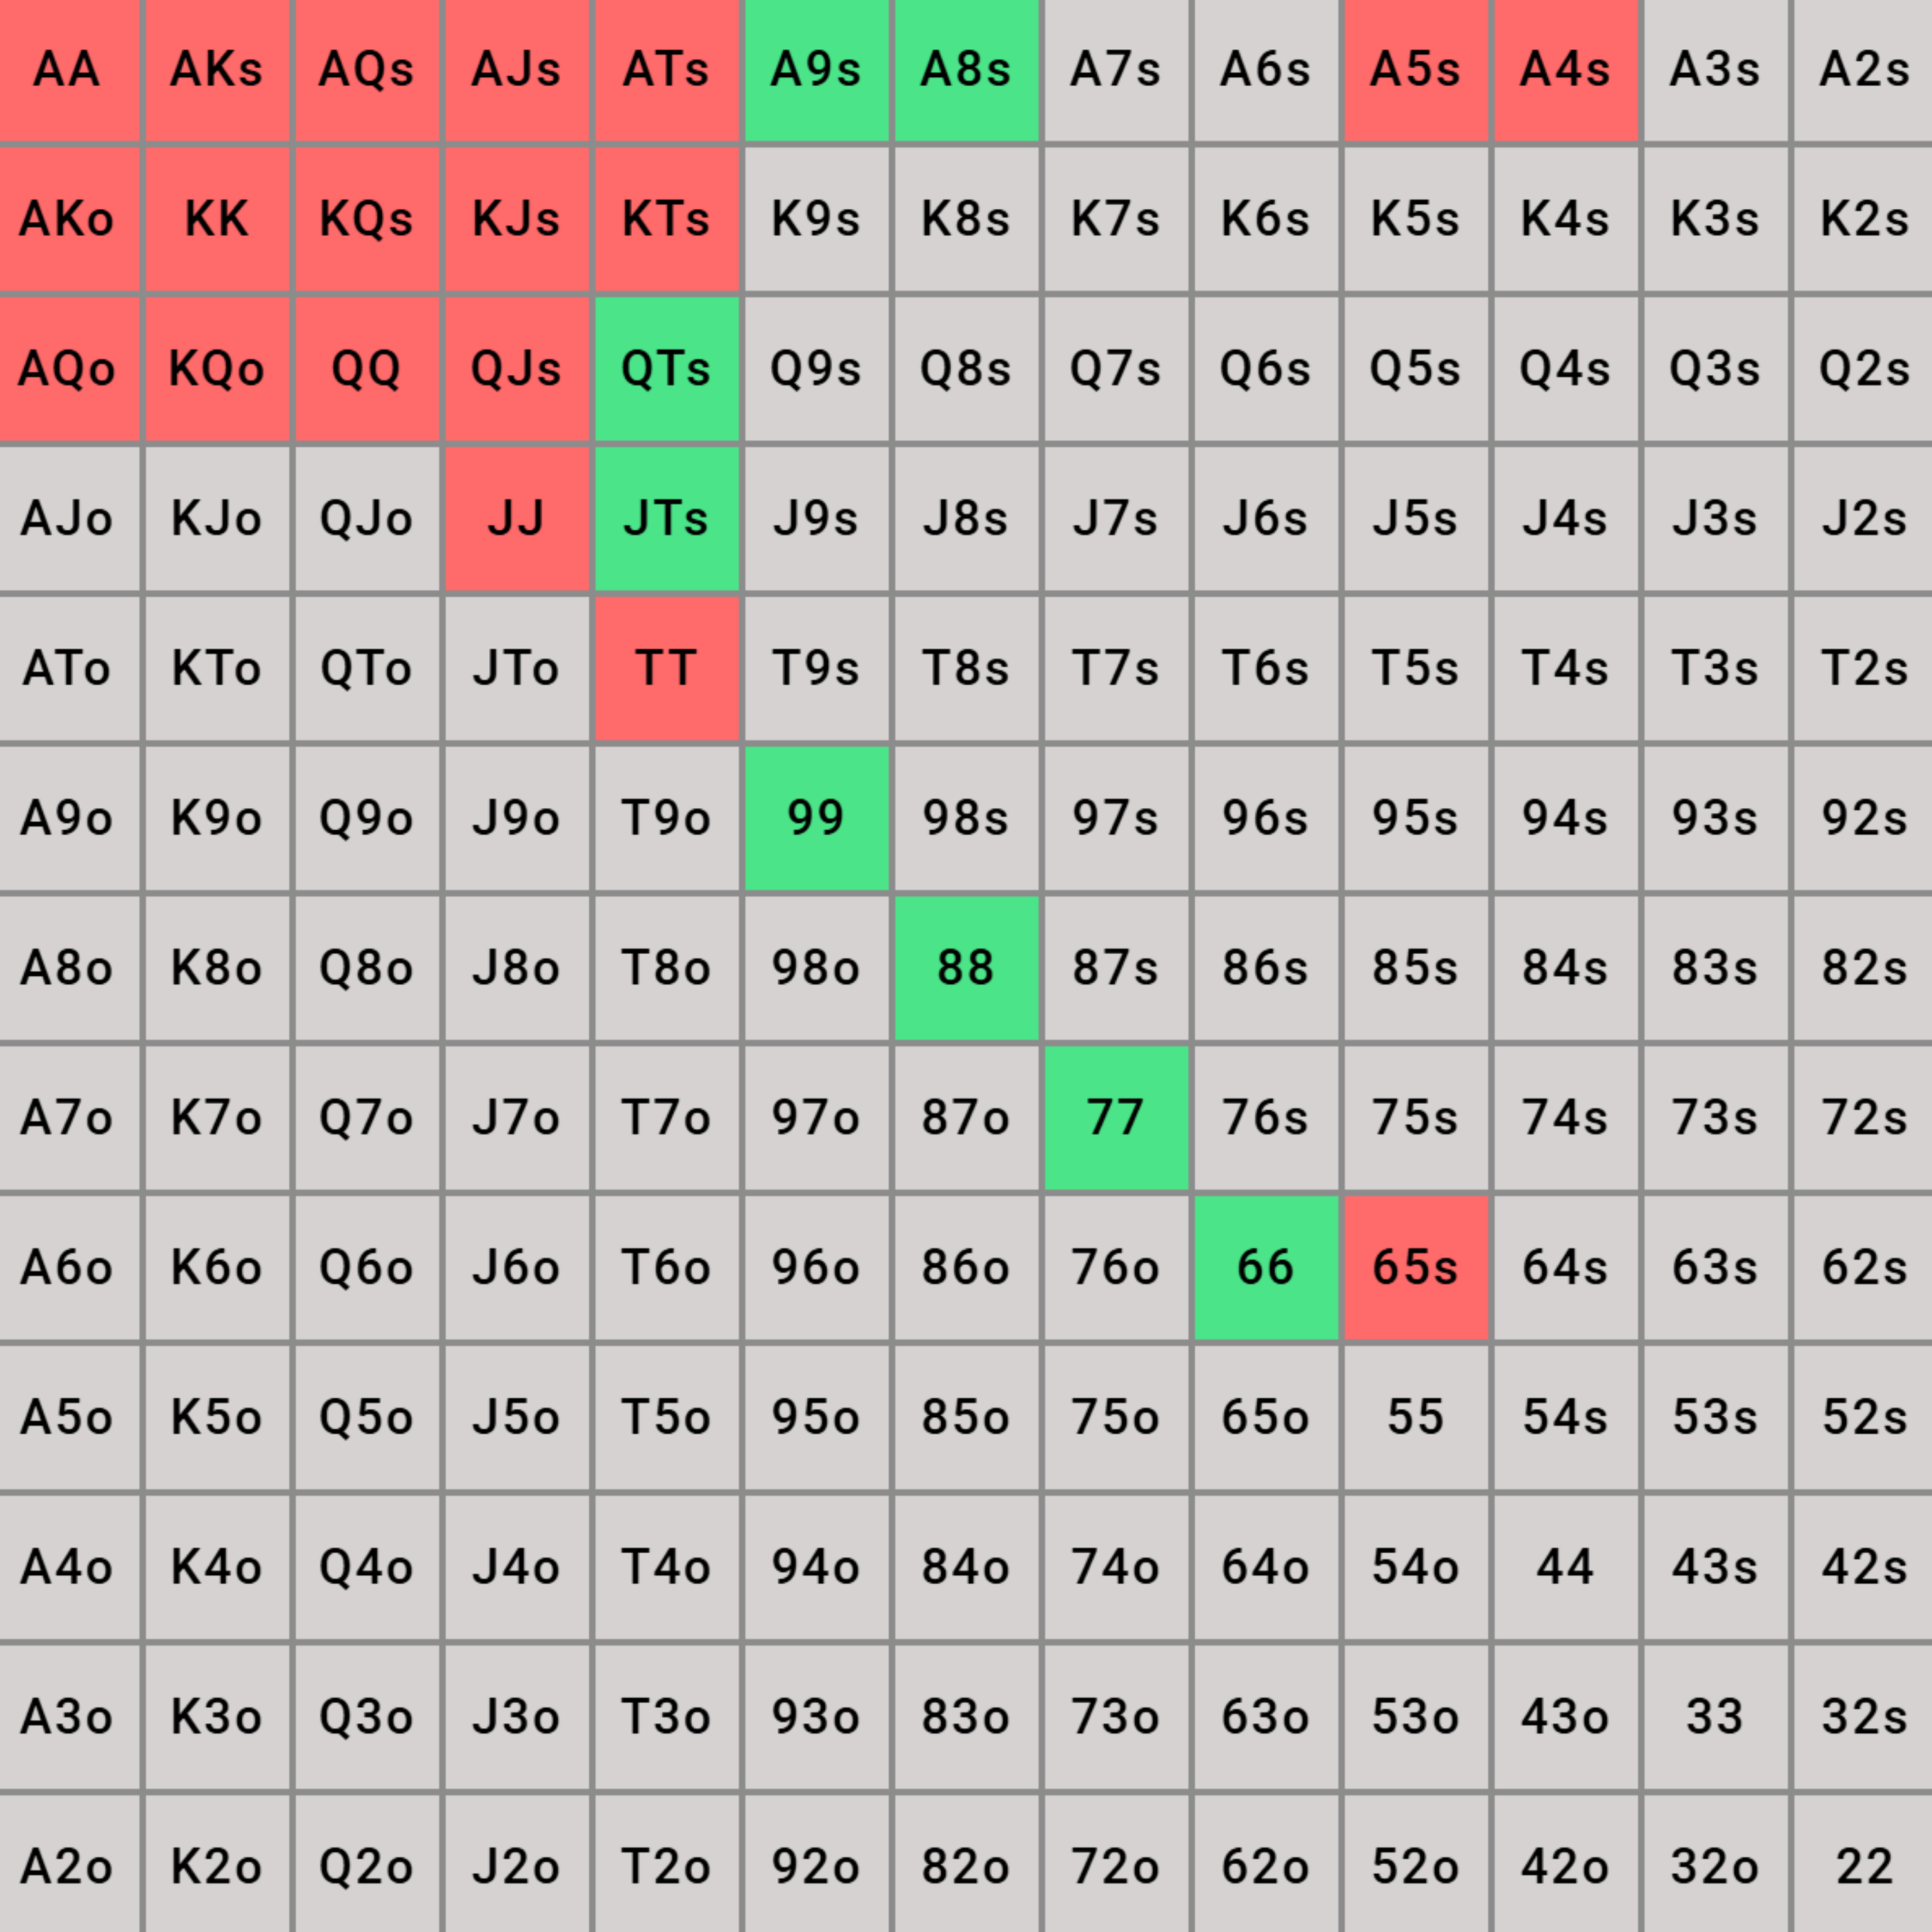
Preflop range charts tell you what your default action should be based on:
Preflop charts use actions such as fold, call, raise or 3-bet. You will use one chart when you are first to act and a different chart when you face an open raise.
Modern preflop charts are based on GTO ranges. GTO means Game Theory Optimal. A simple way to think about GTO is this: It is a balanced strategy that is impossible to exploit.
If you follow good GTO-based preflop range charts, you avoid major leaks preflop. You will not be folding too much, calling too much or playing too wide from any position.
It is still possible to deviate from GTO to exploit weaker players. For example, you might open more hands on the button if the blinds fold too much. But that is an advanced topic. For most players, following solid preflop range charts is already a big improvement.
You always want a chart that matches your game type and stack depth.
Cash games and tournaments play differently. Stack sizes also change which hands are profitable.
Examples:
If you use the wrong chart, you may end up playing too tight or too loose.
A good habit is to decide your main formats and learn those charts first. Many players play mostly one of these:
Preflop charts use a 13 by 13 grid.
Examples:
The chart then tells you what action to take with each hand. Often this is shown with colors. One color might mean fold, another might mean call and another might mean raise. Once you understand the grid, reading poker preflop charts becomes very fast.
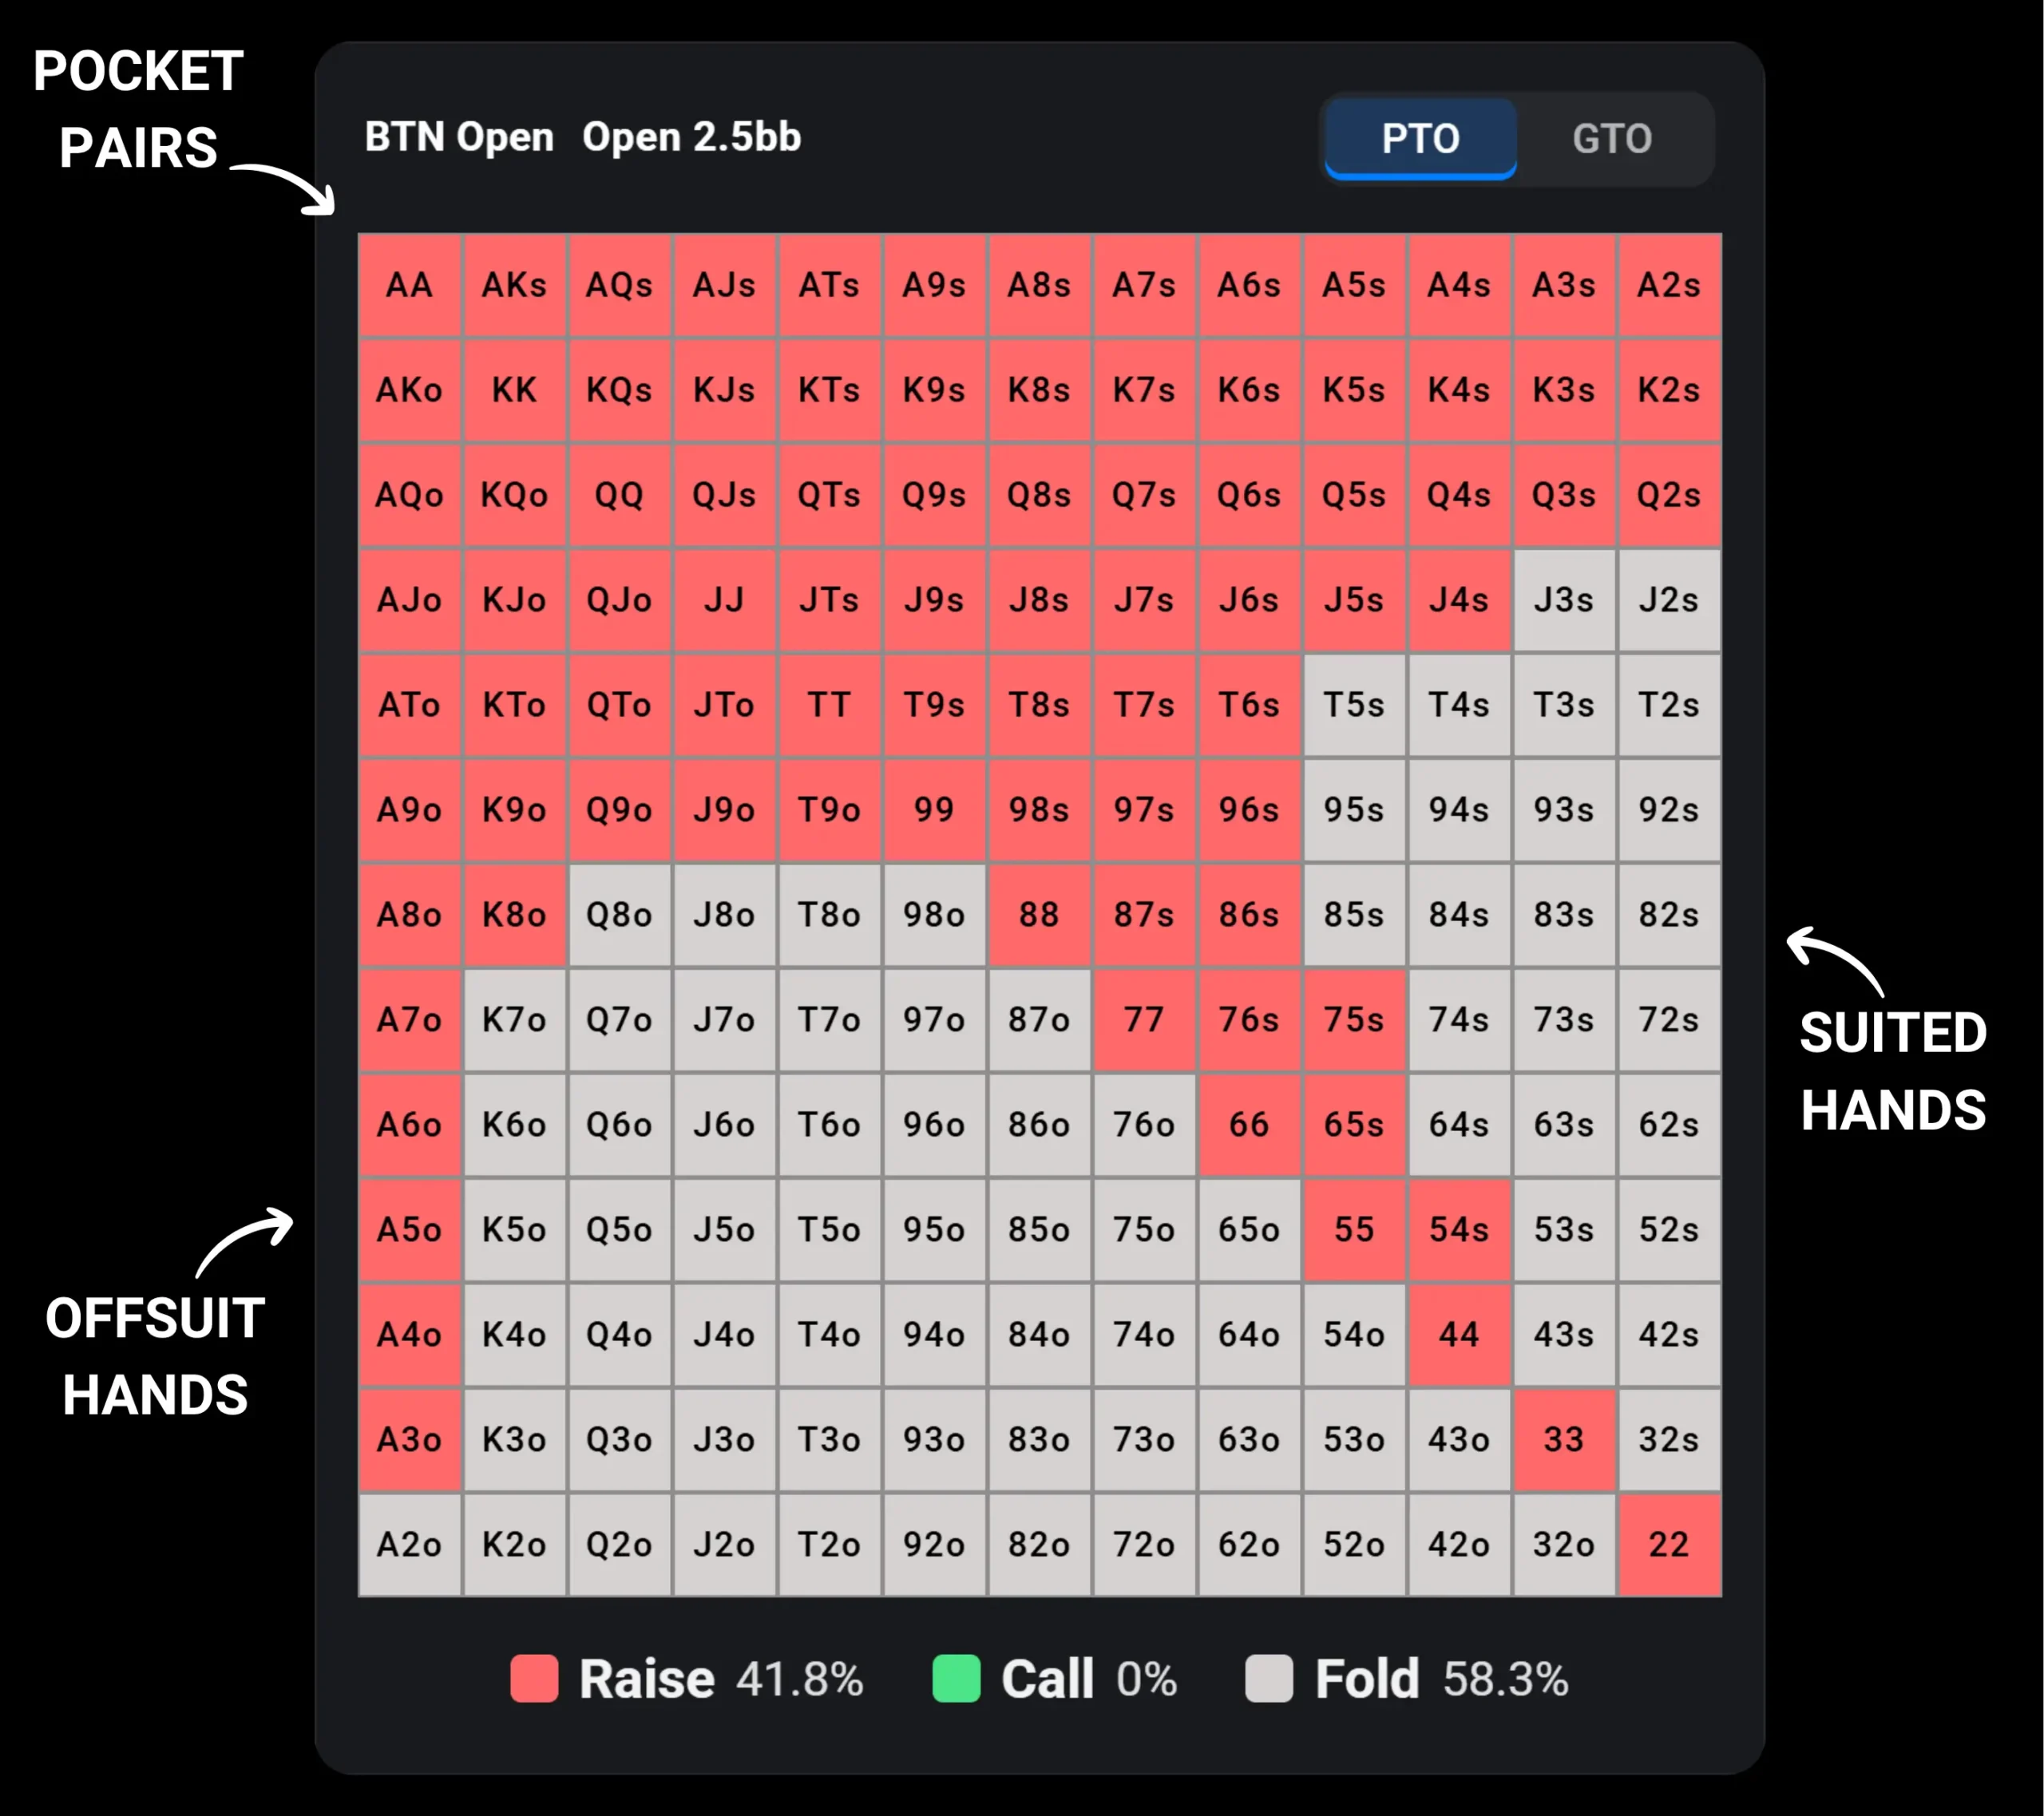
A very common mistake is to treat a preflop range chart like a rule that never changes. Charts are a baseline, not a promise.
Position, stack depth and action matter a lot. A hand that is a raise in one spot might be a fold in another.
Another common mistake is to mix charts without noticing it. You might look at a 100 big blind cash chart while playing a 40 big blind tournament. That leads to wrong decisions.
A practical way to use preflop range charts is to focus on one situation at a time.
Start with the most frequent spots:
Pick a chart, study it and practice it until it feels automatic. Then move to the next chart. This approach works because preflop spots repeat constantly. If you fix one common leak, you gain immediately.
This makes it easy to find the exact scenario you want, such as:
Instead of guessing, you can quickly check the chart and see the correct baseline action. Once you know what the chart says, you still need repetition to make it stick.
It is difficult to memorize a full set of preflop range charts by only looking at them. It is also hard to know if your memory is correct. That is why active practice is so effective.
Use Preflop mode in the Poker Simulator to practice real decision spots and get feedback. Over time, you stop thinking about the chart and start recognizing patterns.
You can also focus your practice by using filters, such as training spots where you face an open raise. This is one of the fastest ways to build real preflop skill.
If you are a more advanced player, you might be interested in GTO charts. They follow the same principles we have already discussed, but add one extra layer. Instead of taking one action every time, some hands use mixed frequencies.
Mixed frequencies means you do different actions with the same hand some of the time. For example, you might have 99 on the button versus an LJ open and 3-bet 50 percent of the time and call 50 percent of the time.
GTO mixes to stay balanced. If you always take the same action with a hand, strong opponents can learn your pattern and adjust. By mixing, you protect both your value hands and your bluffs and make your strategy harder to exploit.
It is also important to understand why solvers mix so much. In solver worlds, both players have perfect “clairvoyance” into each other’s ranges. They always know the exact strategy the opponent is using. That makes mixing a bigger need because patterns are immediately visible.
In real games, opponents almost never know your exact ranges. Even if you do not mix, it is very hard for someone to accurately figure out your full strategy. And if your ranges are well constructed and balanced, it is difficult to exploit them even if an opponent did know exactly what they are.
To apply mixed frequencies in real games, players often use an RNG, a random number generator. You roll a number and follow the chart based on the result. Poker Trainer supports RNG, so you can practice these mixed decisions the same way you would at the table.
For most beginners and intermediate players, mixing is overkill. It adds complexity and slows learning. In most games, you will gain more by playing clean, consistent ranges and focusing on fundamentals. Mixing becomes more relevant in tougher games, especially at higher stakes in smaller player pools where opponents pay attention and adjust.
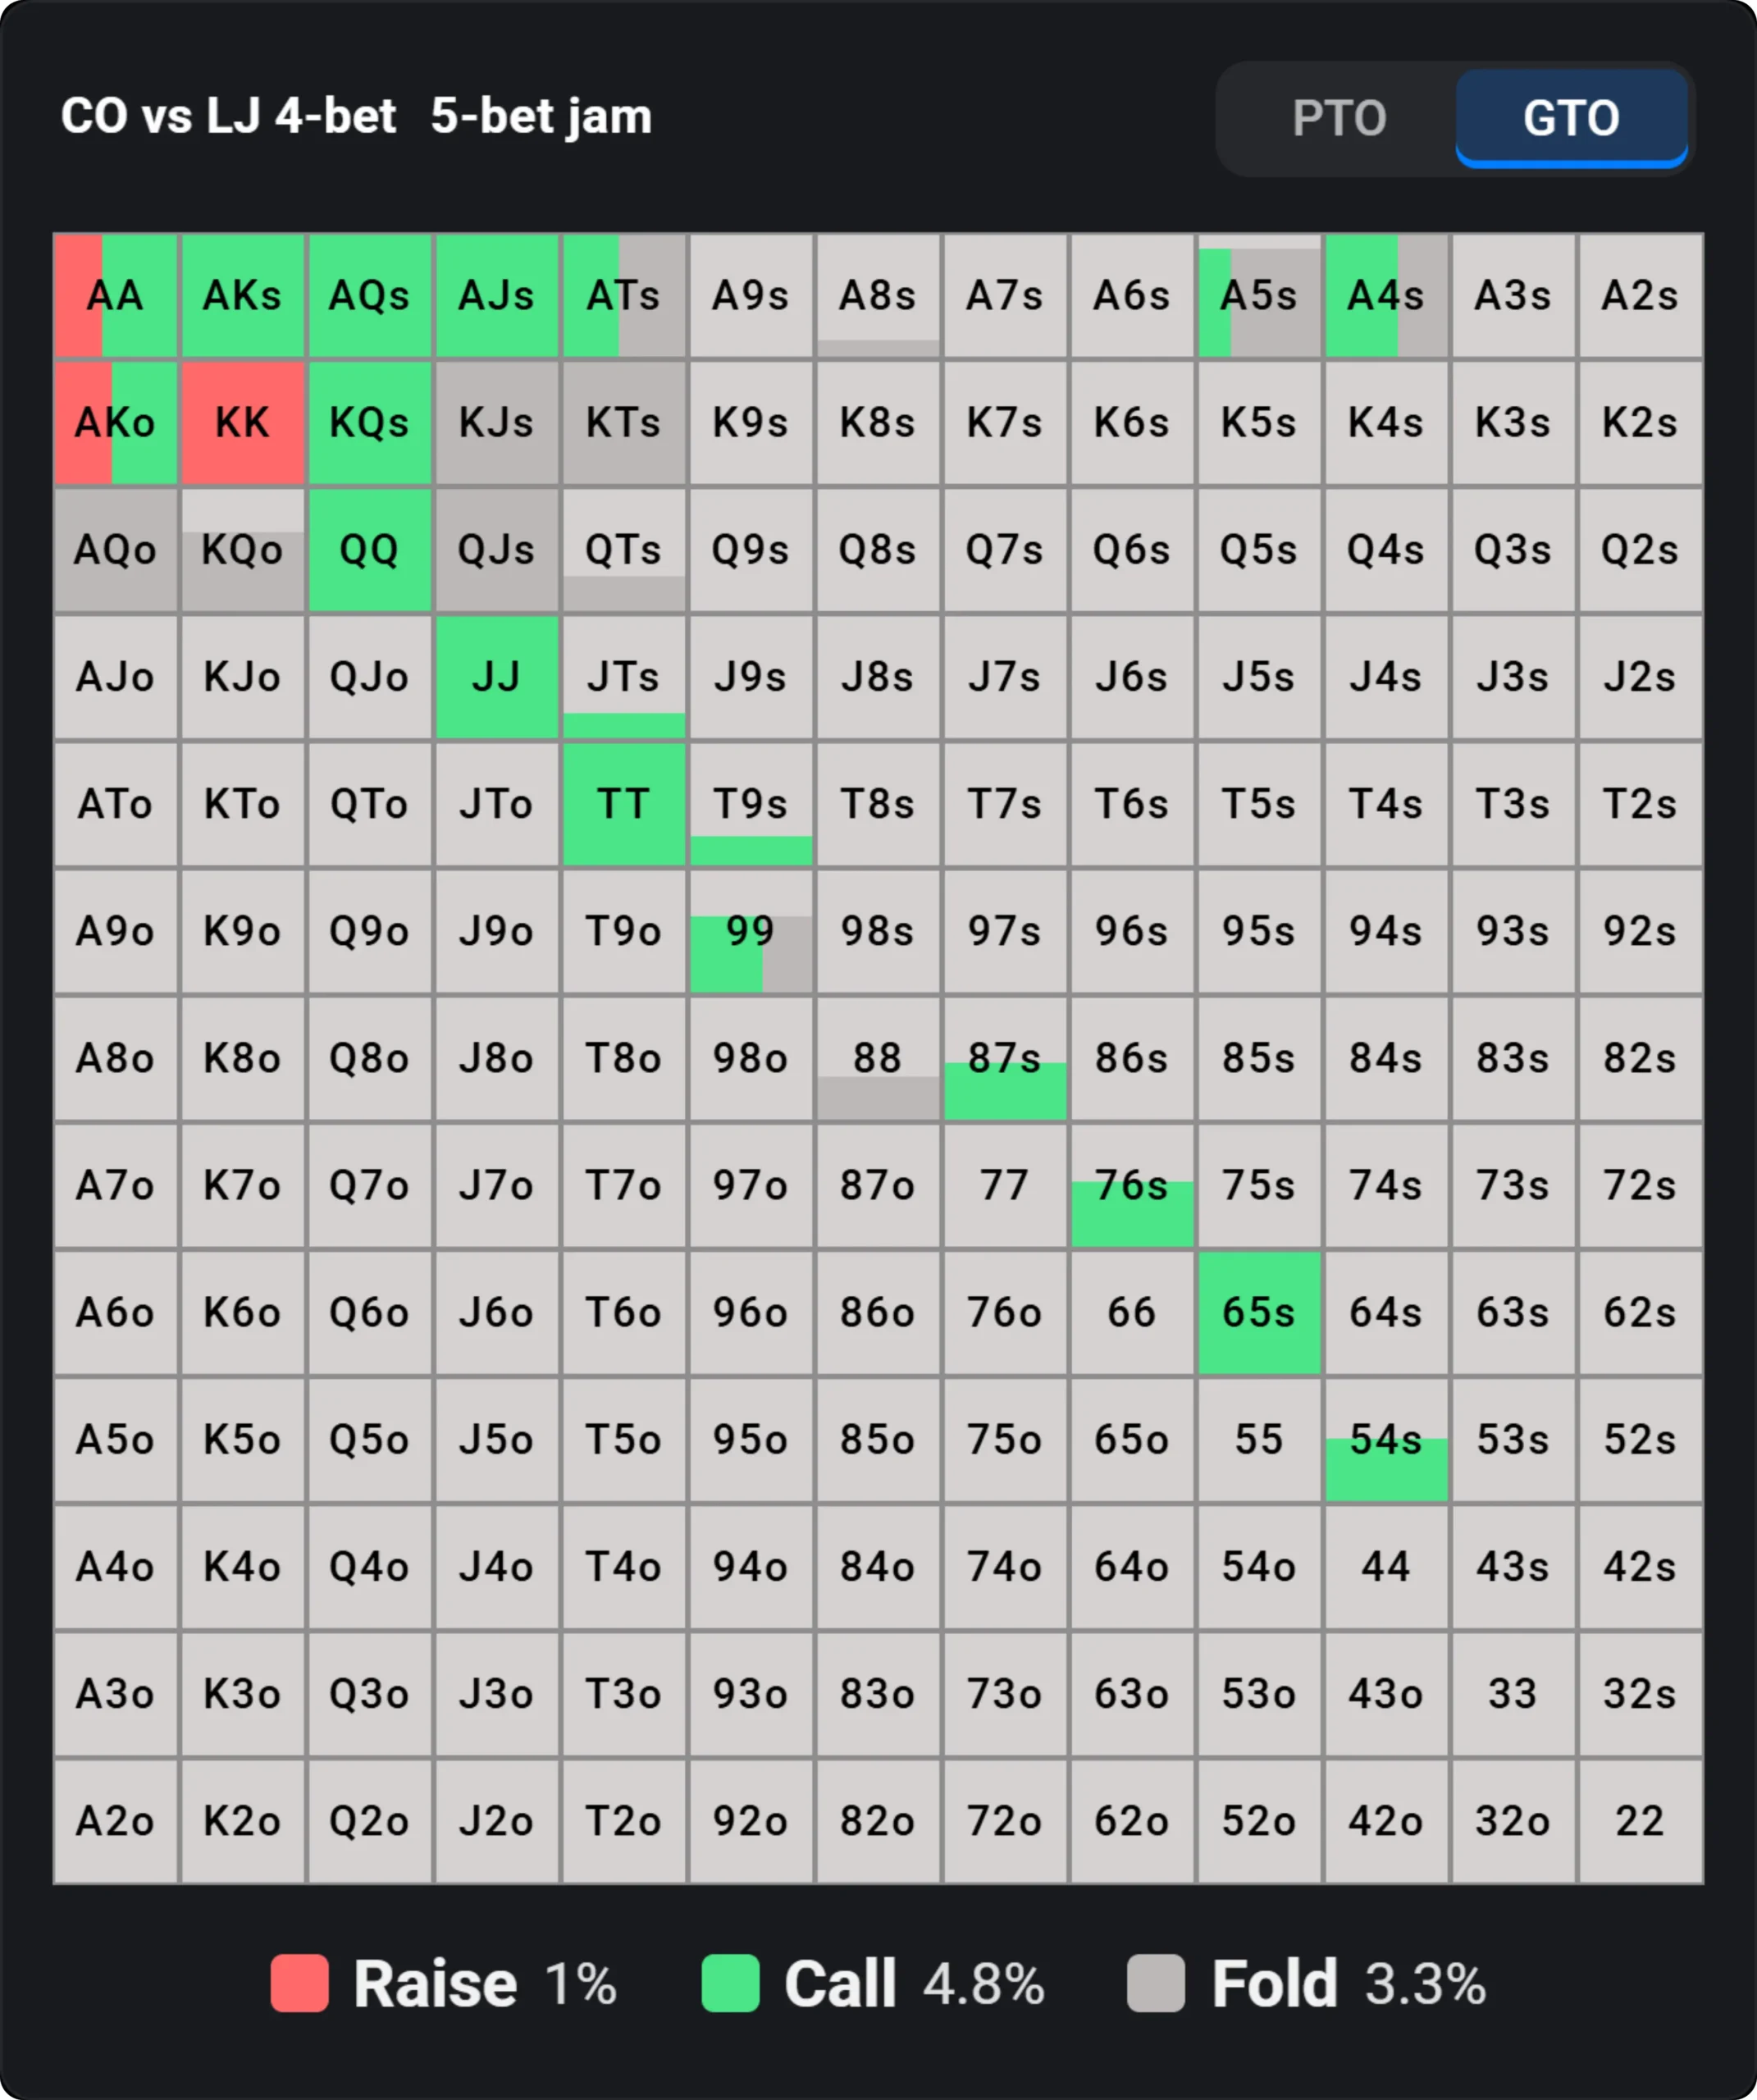
In the chart above you can see the range for the CO facing an LJ 4-bet. If you look at 99, the reduced cell height shows that 99 only reached this spot part of the time, because it was 3-bet at roughly 70 percent frequency in the previous step. In this node, 99 should now call about 60 percent of the time and fold about 40 percent of the time, as shown by the horizontal frequency bar.
T9s, on the other hand, was 3-bet less frequently, roughly 20 percent, which is shown by the reduced cell height. But when it does reach this spot, it is calling 100 percent of the time, which is shown by the fully green horizontal bar.
A5s was 3-bet roughly 50 percent of the time, which is shown by the cell height. In this spot it now uses mixed frequencies between raise 20%, call 50% and fold 30%.
Preflop range charts are a shortcut to better poker. They turn guesswork into a structured baseline strategy.
Poker preflop charts are especially useful for beginners and intermediate players because they fix the most common leak: playing the wrong poker starting hands from the wrong positions.
Start with one format and one stack depth, learn those charts well and practice until decisions are automatic. Then expand your library of charts step by step.
As you become more advanced, you will learn when to step away from preflop range charts to exploit specific opponent mistakes.
In poker, you can win a hand in two ways. You can win by having the best hand at showdown. Or you can win by making your opponent fold…

Many players see a decent hand and they bet. They see a weak hand and they check. This often leads to decisions that are hard to explain later…
| Cookie | Duration | Description |
|---|---|---|
| cookielawinfo-checkbox-analytics | 11 months | This cookie is set by GDPR Cookie Consent plugin. The cookie is used to store the user consent for the cookies in the category "Analytics". |
| cookielawinfo-checkbox-functional | 11 months | The cookie is set by GDPR cookie consent to record the user consent for the cookies in the category "Functional". |
| cookielawinfo-checkbox-necessary | 11 months | This cookie is set by GDPR Cookie Consent plugin. The cookies is used to store the user consent for the cookies in the category "Necessary". |
| cookielawinfo-checkbox-others | 11 months | This cookie is set by GDPR Cookie Consent plugin. The cookie is used to store the user consent for the cookies in the category "Other. |
| cookielawinfo-checkbox-performance | 11 months | This cookie is set by GDPR Cookie Consent plugin. The cookie is used to store the user consent for the cookies in the category "Performance". |
| viewed_cookie_policy | 11 months | The cookie is set by the GDPR Cookie Consent plugin and is used to store whether or not user has consented to the use of cookies. It does not store any personal data. |